What's new?
New stock ideas will be updated soon.
Click on the 'Subscribe Now' button to get these calls instantly.
A quick update with some charts: This week we should be hitting the downward sloping resistance and from there begin a downward journey. This will be very crucial and should go onto test the lows we made a few weeks back.
At this point, we will not be buying this market but wait on the sidelines and see the market action in the pullback.
Dow:

Sensex:

We bought half of our position in CBST today at 24.19. This is a new pick and a more detailed analysis will be done over the weekend.
We reinitiated a fresh short in AKS today. The price was at 35.15.
On hindsight we should have waited for a 'red flag' candle.
As we expected, it was a very volatile week. All markets had a major crash in the middle of the week with the DOW and FTSE recovering on Friday. Asian markets have started off strongly today.
The end of this correction is in sight. However before the new rally begins, a base will be built. The lows that we have made over the week might be tested. If we look at the charts, we don't see a candle, ie, the close was not at the lows but rather the lows were intraday.
With this structure we can visualise 2 scenarios:
- The lows that has been formed will be revisited, ie, a new low or very close to the previous one will be made. This will be marked by a big red candle on a weekly or daily chart. This means that the close will be at the day's low unlike what we saw in this week.
- The lows that have formed will not be breached but a quiet period will follow in which the market will oscillate in a narrow range at last week's close. This is called volatility compression. This will be marked by a series of smaller candles on a weekly or daily chart very close to this week's close.
We will wait and observe the market for either of these structures. Our preferred view is the first option listed above. Ideally speaking we should form this either the ensuing week or the next.
We also used yesterday's lows, to pick up some index funds(
HDFC Index Fund and
HDFC Index Plus Fund) and midcap funds(
Sundaram BNP Paribas Select Midcap)on the Indian markets. This corresponds to 50% of our allocation for mutual funds. We will most probably increase our short holdings in the US market over the course of this week.
We covered our short of AKS today to the extent of 40% at 28.30. Our net gain on this is 25%. We still some weakness in this stock but for now it is oversold. If we get a good price tomorrow, we will cover the remaining. Else we will wait for a rally to initiate fresh short positions.
After a rather weak and jittery 2 weeks, we have had a nice rally all across the board. The FTSE, Dow, Bovespa, HSI and the Sensex all made signifcant highs while the Nikkei was marginally high.
Does this mean that this is a time to buy?
As we know, whenever we have a downturn, the markets always build a base. As we haven't built a base yet, it's still not a time to turn bullish. It will be interesting to see what happens in the pull back. Will the prior lows hold or will we go onto breach those lows.
As we had noted that this week we will probably be marginally higher, we were off by a small %. However the nature of the rally has been ferocious.
At this point, inspite of the good picture all around, we will continue to exercise caution and still believe that we should breach those prior lows and build a base. From a medium to long term perspective, it will be good for us to have a little more correction before the bull run commences. Else we will have a suspect rally which has a higher chance of failure.
We sold off the remaining position in USHBEL today at a price of 273.5. With this we have no long positions in any of the markets.
Our only position is a short in AKS.
A few days back we noted that FTSE will be the index to watch. Needless to say today's weakness on the US markets was triggered by the FTSE.
Compared to this, look at the media headlines after today's crash on the DOW:
Dow Sinks 226 on Mortgage Market Worries
Headline for the crash on FTSE:
FTSE down on subprime lending woes, US market drop
The reality is that the FTSE was down almost 1% before the US markets opened. When the FTSE closed down 1.9% for the day, the DOW was down only 70 points. It was only towards the close of the day that the DOW plunged.
Watch the FTSE - it's been showing weakness for some time now. From what we can make out, for the last few days, the DOW follows the FTSE and tomorrow Asia(maybe excluding China) should follow the DOW.
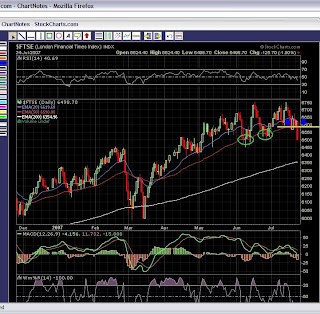
Also take a look at the chart below. Previously, though the FTSE moved below the 50EMA, it managed to close very close to it and subsequenly recovered. However after today's plunge, it has blown past the 50EMA and the next support is the 200EMA with the 50EMA being the obvious resistance.
Let's do a Wolfe Wave analysis on 3 indices - FTSE, S&P500 and BSE. This exercise will be split across 2 parts - the first part will cover the Wolfe Wave analysis in recent history. The second part will be applied on the possible scenarios that we can expect in the coming few weeks.
The Wolfe Wave:
In technical analysis, it is a naturally occurring trading pattern present in all financial markets. The pattern is composed of five waves showing supply and demand and a fight towards an equilibrium price. These patterns can develop over short- and long-term time frames such as minutes or weeks and are used to predict where a price is heading and when it will get there.
With that in mind, let's apply the Wolfe Wave to 3 Indices.
FTSE:

BSE:

S&P500:

Let's look at the Magic Numbers at play on the Sensex. This exercise will be split into 3 parts - The Feb Correction, The March Bottom and The June Breakout. For the 'Feb correction' all numbers are in place and they are being used to show how important these numbers are. The 'March Bottom' and 'June Breakout' are still ongoing and the top is assumed at 15675.
The Feb Correction:
This can be seen from the charts and it is self explanatory. Starting at the top of 14724, the 38.2%, 50% and 61.8% stand out as very important numbers to the 100% mark at 12316.
The March Bottom:
This number sequence starts from the bottom at 12316 and the top is assumed at 15675. With this in mind, the numbers work out really well. We see:
1. The 61.8% mark acts as the first resistance to the upmove.
2. The 38.2% mark acts as the first support to the upmove.
3. The 50% mark now acts as the support to the upmove.
4. The 61.8% mark now acts as the final support to the upmove.

The June Breakout:
This is actually the Magic Numbers in the 68.1% to 100% region of the 'March Bottom' chart. We see:
1. The 0% offers the first strong support to the breakout.
2. The 38.2% mark sees the close of the doji.
3. The 61.8% mark offers the final support to the breakout.

The markets broke down in the early hours and then pulled back strongly to close the day marginally down(DOW) and marginally up(India). However the FTSE was down almt 1.4%. Increasingly we feel that the FTSE will be the index to watch.
With today's close, the FTSE closed below 50EDA and that raises a strong red flag. However we have veen bearish for a while and the markets have moved abt 2-3% since then. So we will keep our short positions light and watch what the markets have in store.
Attached below is the 'MAGIC numbers' on the FTSE chart. If the numbers fit well, then we have already seen the top and the bear is tightening its grip on the index. If FTSE breaks, the rest should follow soon.

Contrary to our bearish views, the DOW zoomed past the mark that we were watching - 13710 to 13870 and closed at 13860.
At this point, we still remain bearish and though the indices don't look like stopping, we will remain on the sidelines. Our short of AKS is in the red by abt 5% and that remains our only position.
India:
We have had a beautiful start to the day. However it has opened with a gap-up and this marks the exhaustion gap. We should see some weakness here. In addition to this, it is now at the rising channel and should come down from here.
We bought a few more options yesterday and our average on all the option is now 74. Though the exhaustion gap is a bearish sign, we are not sure if we need to add onto our positions as corrections usually don't begin in the third week of the month. In case we decide to add onto our positions, we will update the same.
Since the Index has crossed the 15100(Sensex) and 13710(DOW)mark, that we were observing, it is really something unexpected. We don't see a reason to enter the market right now, apart from going short. Since the market seems to have a mind of its own, we will keep our short positions light.
Today, we will discuss how profitable and risky the game of options can be. As you might be aware, options are inherently a high risk/profit instrument. In addition, their inherent loss of value thru time decay makes us use options very rarely. Before we go into when Options need to be used, let's take a look at yesterday's trade.
For instance, yesterday we bought the 4400 July PE at 85 when the Nifty was trading at 4400. Though the Nifty did close later in the day at 4387, ie, 13 points down, the put actually closed at 75, ie, it had lost some value because of time decay.
The lesson that we can learn from this is that - Options should be bought near to the close of the day and need to be sold in the early hours of trading. Also options should be used when a large swing is to be seen. We used options(call) in early April because we saw that a huge swing was in the offing and had fabolous gains. Similarly we use them now because we feel that the trend is changing to the negative and we see a good swing in the downward direction.
If, for instance, we had traded options in the month of May, the profits would be very less, even if we got the index movement correctly, because the time decay would have eaten away what little movement was made by the indices.
That being said we will put an order at 49 for 4400PE today and we will see if it will be executed. This will be the last of the options that we will buy.
We bought Nifty 4400PE(Jul 2007) at a price of 85. This is a positional call.
Today is the Infy results and will have some definite impact on the market.
Market recap:
The DOW and FTSE had a bad day today and down almost 1.2%. The resistance that we have been talking abt, came into effect and sent the markets tumbling. In addition, we feel that this is definitely the start of the correction and as can be marked on the charts, the logical first target will 13000(38.2%). Also take a look at the RSI. The band, as shown in the chart, has been acting as a resistance and support. So far the resistance has worked. Will the support work? Refer the chart for more details
The Nikkei and Hangseng, though down almost 200 points at one time, have recovered marginally.

India:
Today is the big day - Infy results. That being the case, the global markets are sure to put pressure as well as we were at strong resistance.
In addition to the resistance, take a look at the candlesticks. We had a doji(Point B) and a bearish engulfing (Point A and B). Both are bearish patterns and go in line with our bearish view. Notice the candlestick pattern once the RSI starts moving down - Doji and bearish engulfing in both the cases. Refer the chart for more details.
Depending on price behaviour we might build short positions today. We expect the market to hold up in the morning because of the Infy results and then subsequently go down. If that is the case, we can build some short positions today.

As we have previously noted, we have the following view on the markets:
- US DJI - bearish. The view will change only if we cross 13710.
- India Sensex- topping. We said our target will be 14950-15100. The Sensex hit 15007 before closing around 14965.
Having said that, we feel this week will make the direction clear. Use oppotunities in the start of the week to unload all holdings. As we approach the middle of the week, we can build some short positions in the Indian market. In the US markets, we already have short positions.
Let's look at some of the secondary indicators:
Nasdaq Bullish %:Though the Nasdaq has been making new highs, the BP index has failed to make new highs. This negative divergence has helped in timing previous corrections and goes in line with our bearish view. The chart provides more information.

DOW Bullish %:The chart is self explanatory. The negative divergence bolsters our bearish view.

We saw the red signals yesterday and accordingly started moving into cash. Let's see what we can expect:
The DOW and the S&P500 both closed almost unchanged. However the Nasdaq was up .45% and closed at 2656.65. With this the Nasdaq has the hit the 38.2% retracement of the corrective from its 2001 peak. It is natural for this to be a very strong resistance.
The DOW is stuck in a range and it can move either way. However we feel that most likely way is downward. Accordingly our bearish view continues as before.
The Nikkei and the HangSeng both opened in the red. But the Hangseng has since recovered.
India:
Up strongly in the morning, the Sensex hit 14964 and then went down from there almost 230 points to hit 14730 before recovering from there to close marginally down. The resulting doji leaves a very bearish cloud hanging over the markets. Accordingly we moved signifincantly onto cash, with some holdings still left (Click here for current holdings and past performance).
Charts:
If we see the charts below for the Sensex, DOW and the Nasdaq, you will see that all 3 are now hitting resistance trendlines. They have also shown the doji on the charts. The markets remain overbought and our preferred view is that they should correct. See the chart for more information.


We sold another 25% of MORGOK @ 477 and 50% of our second position in BANIND @ 219.5.
No puts as yet. We will initiate puts once we have started trading below the channel that we talked about.
We closed out our old position in BANIND at 221.5. That leaves us with the new position we started at 192.
We sold another 25% in MORGOK. Average price of 481. That leaves us with 50% position still remaining.


